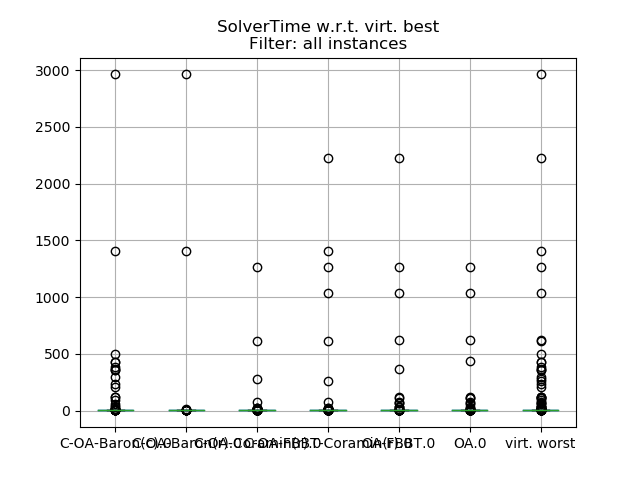
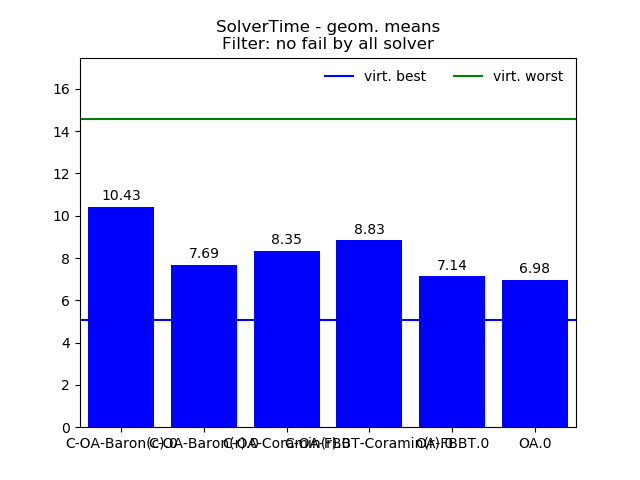
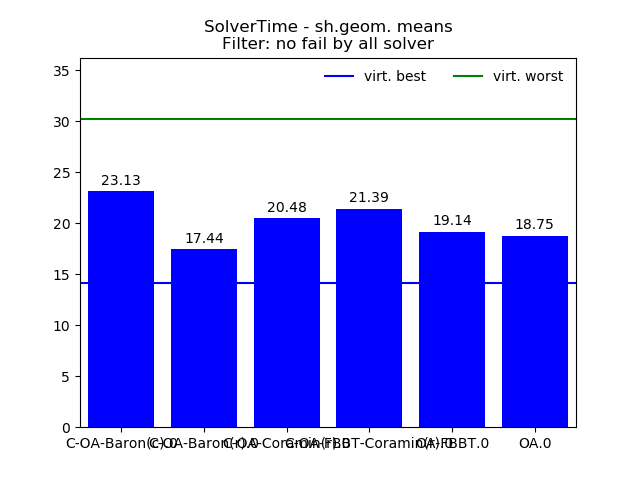
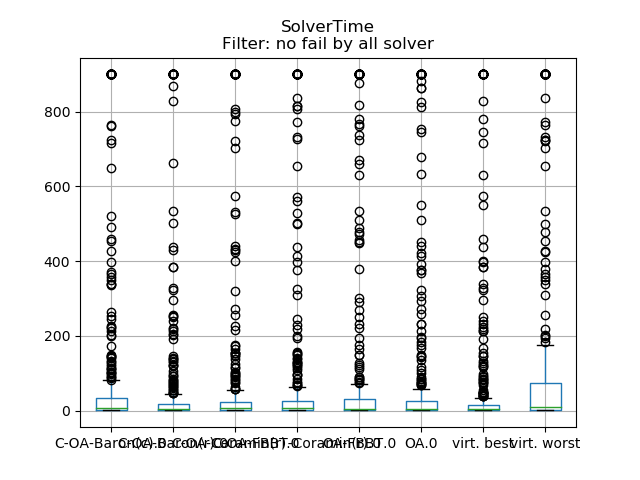
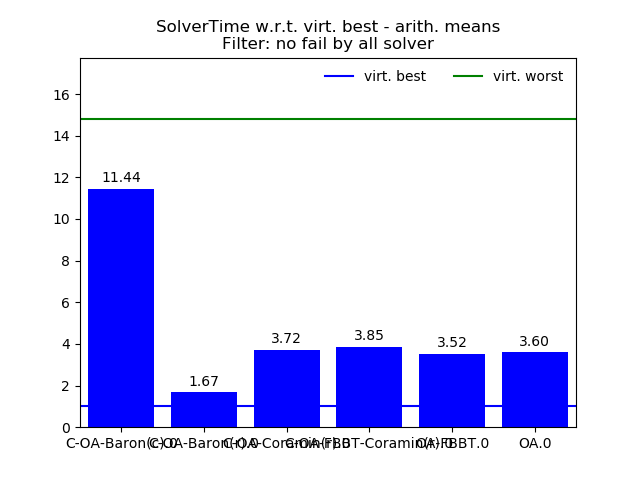
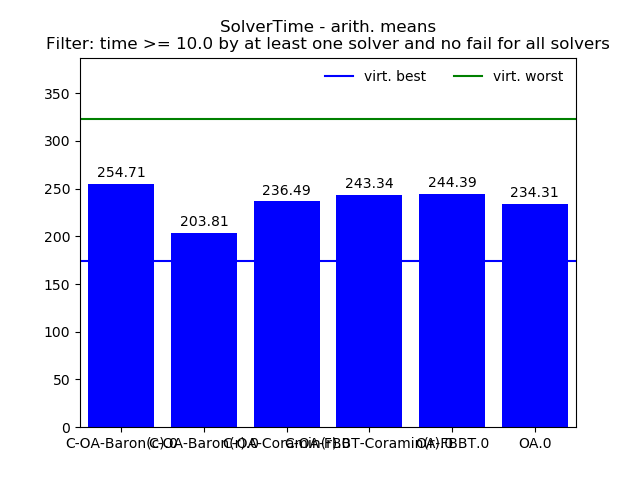
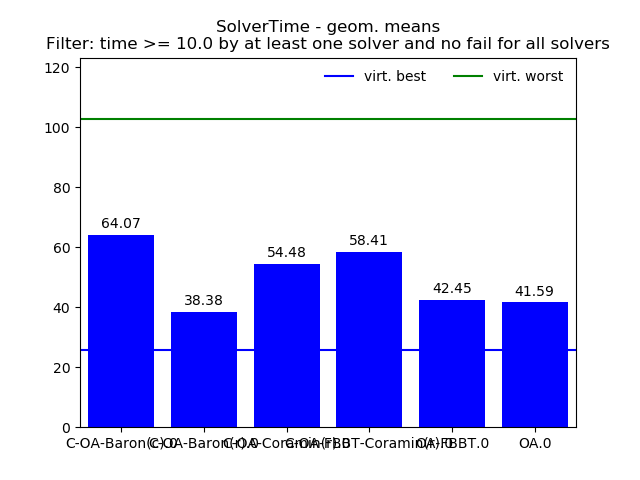
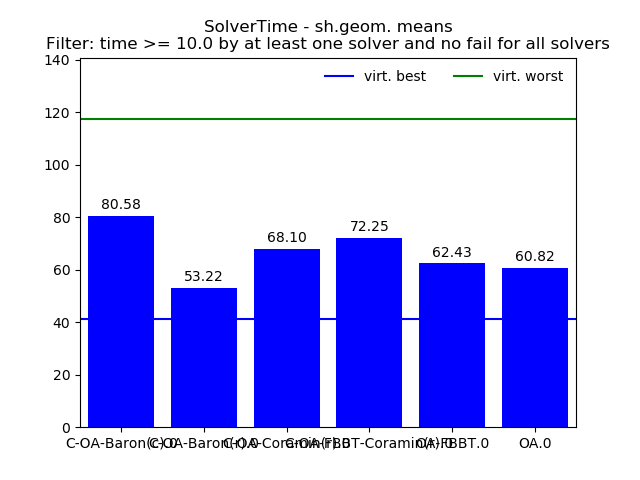
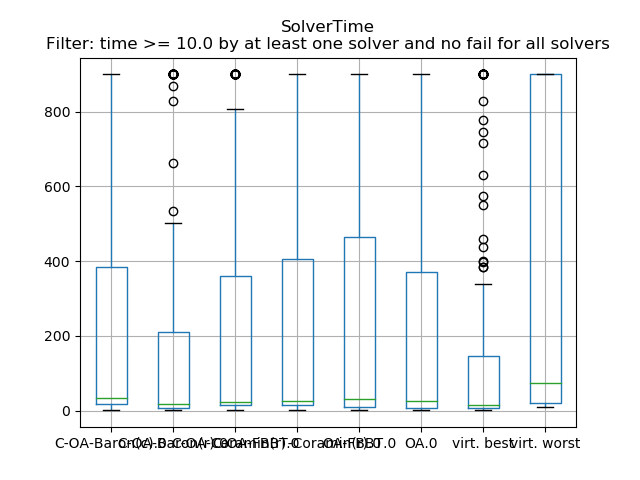
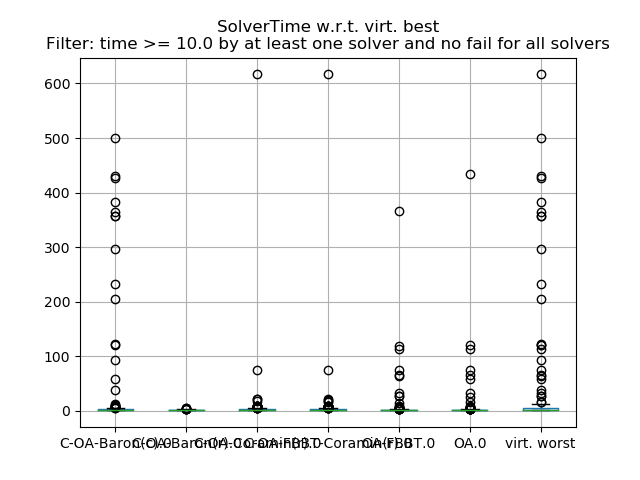
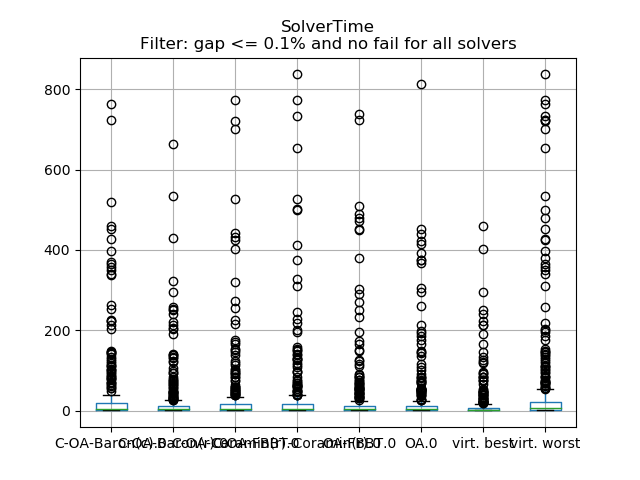
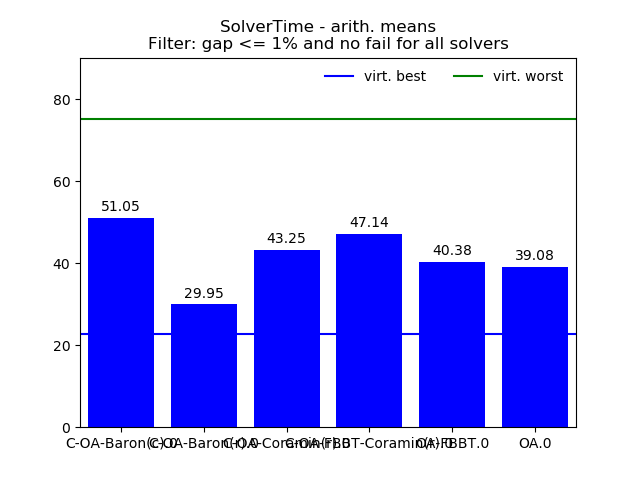
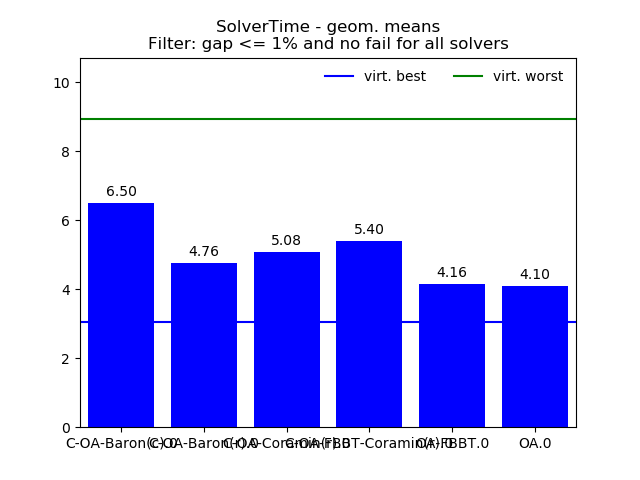
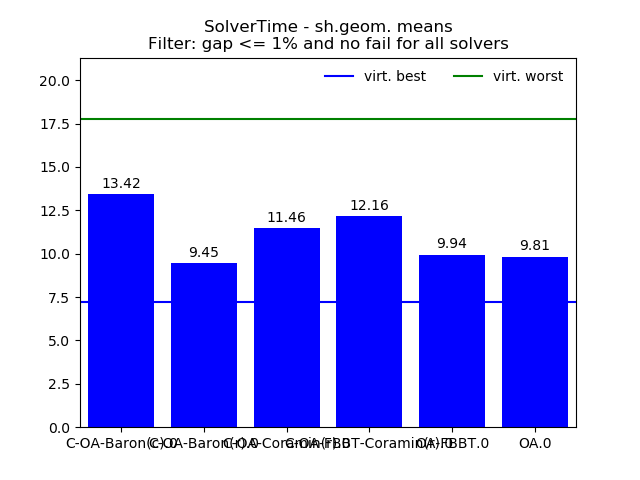
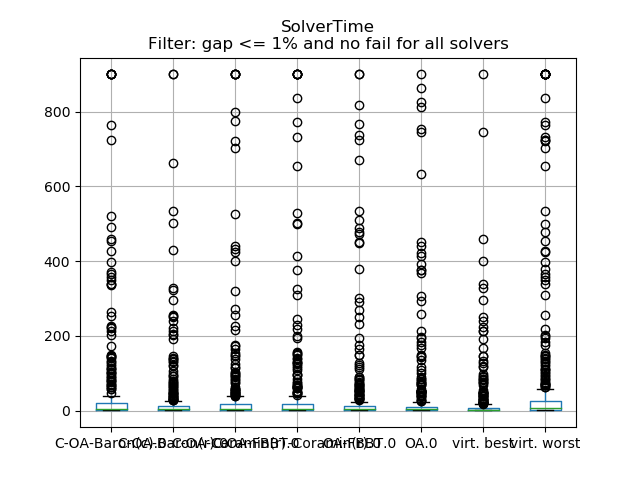
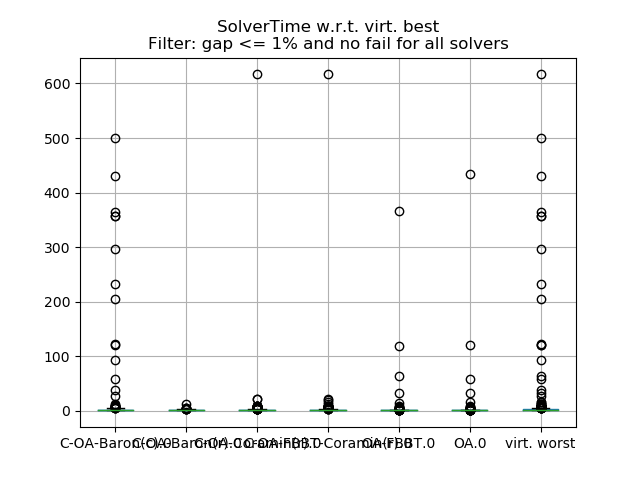
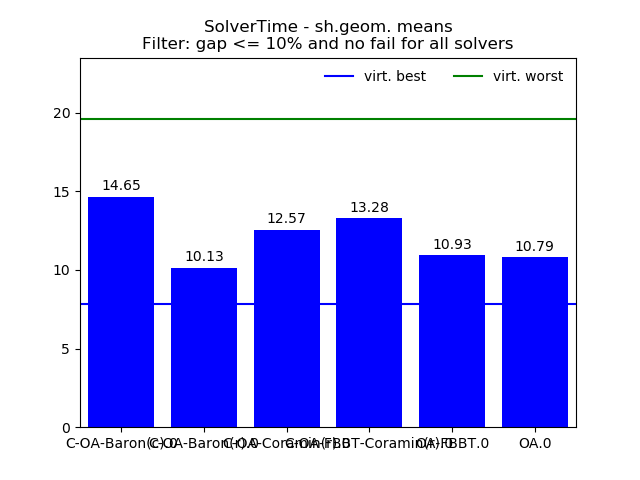
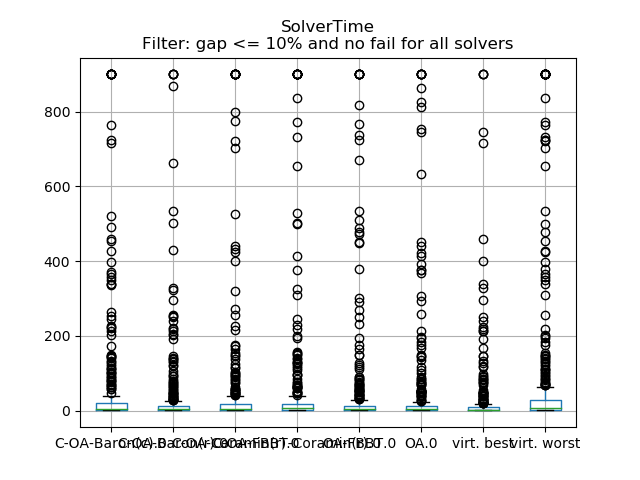
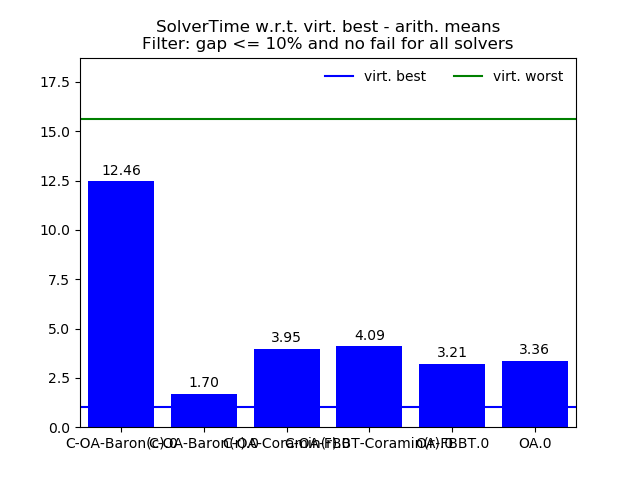
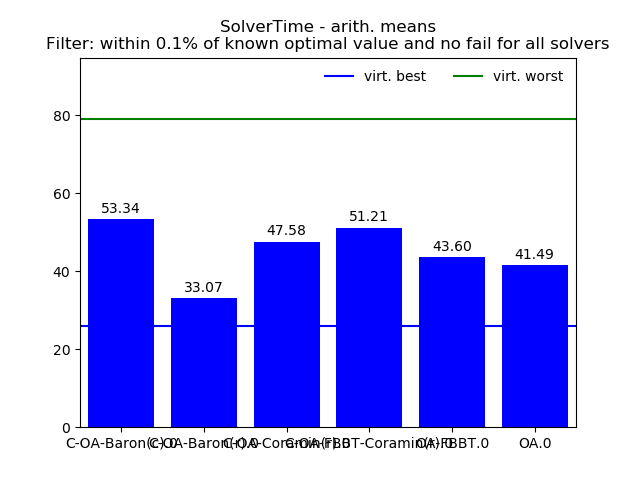
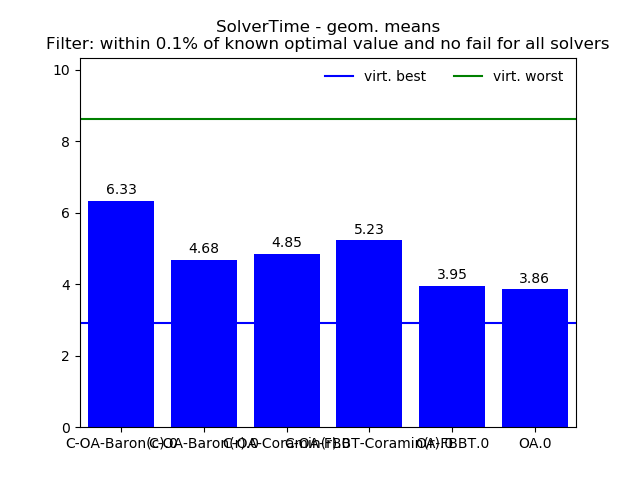
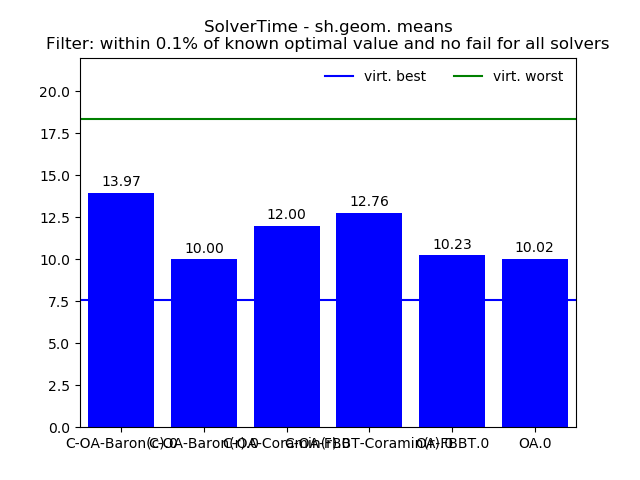
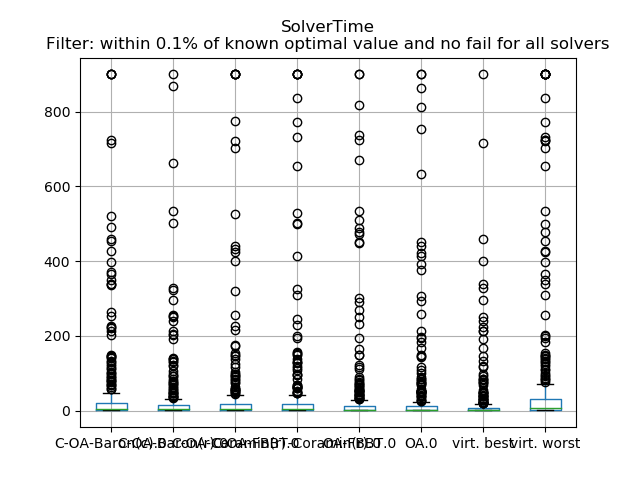
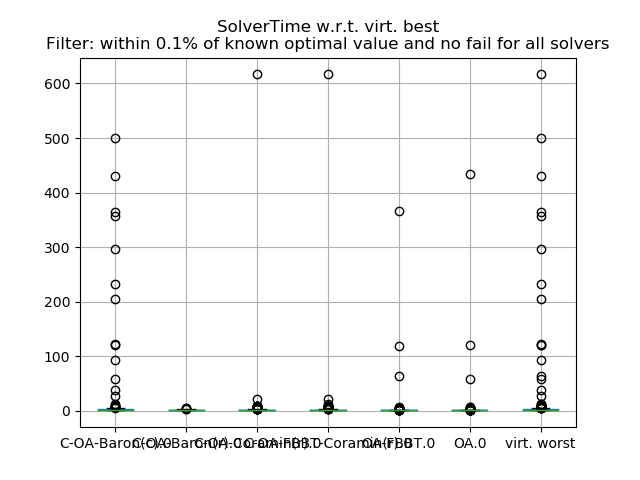
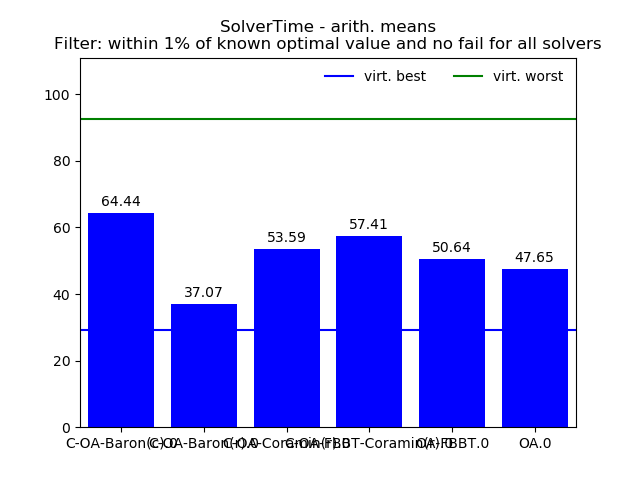
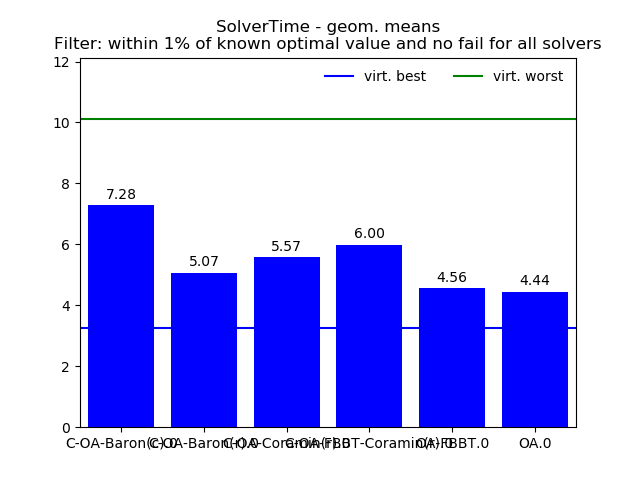
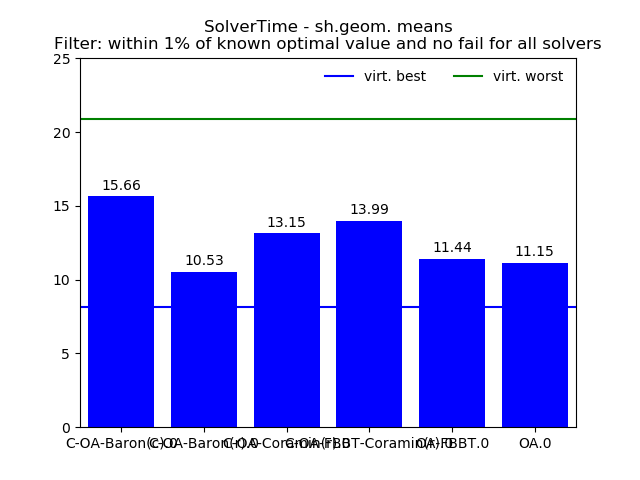
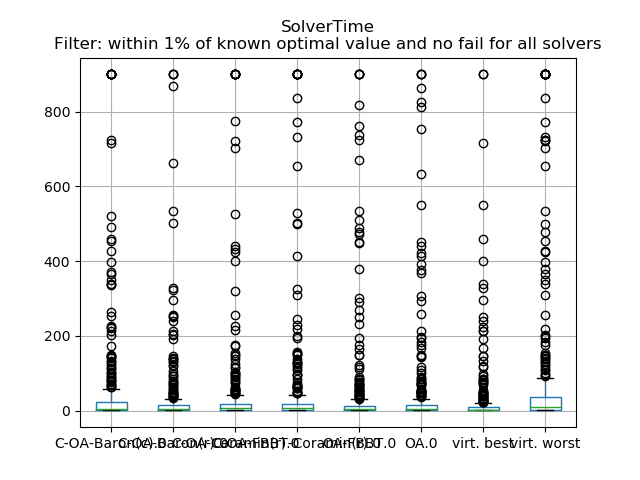
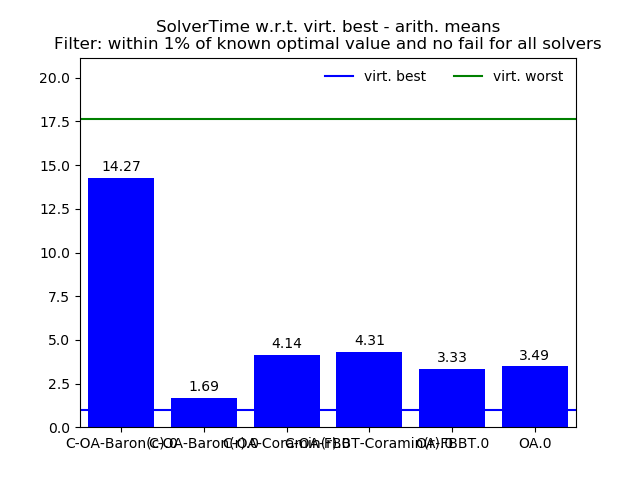
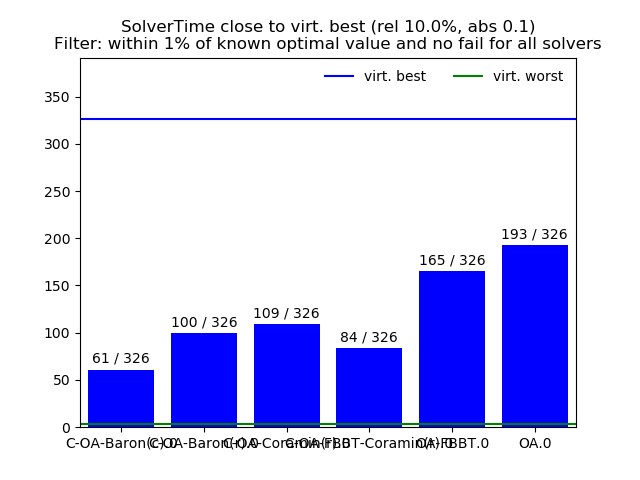
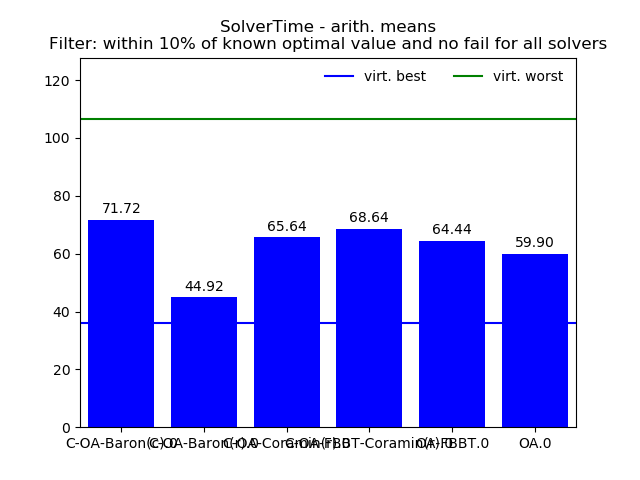
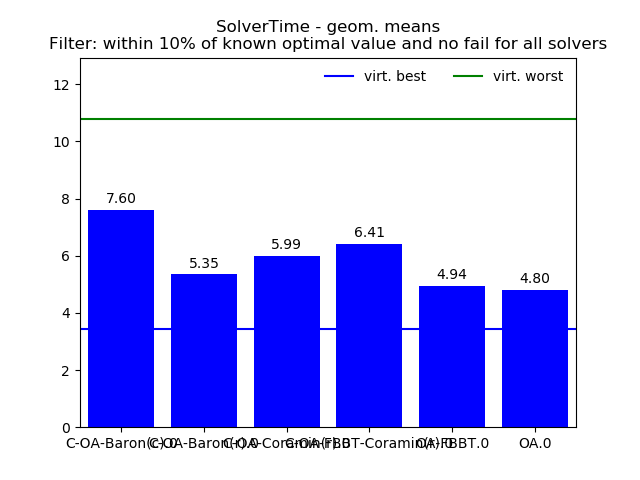
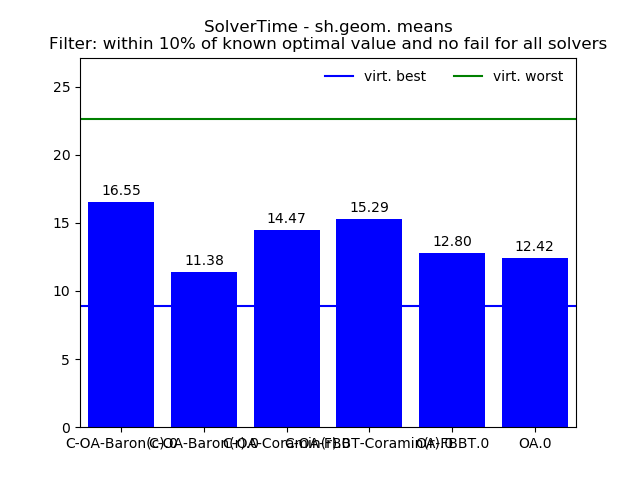
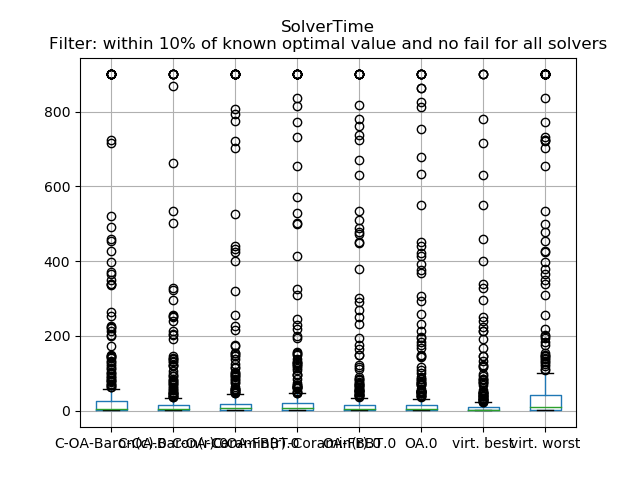
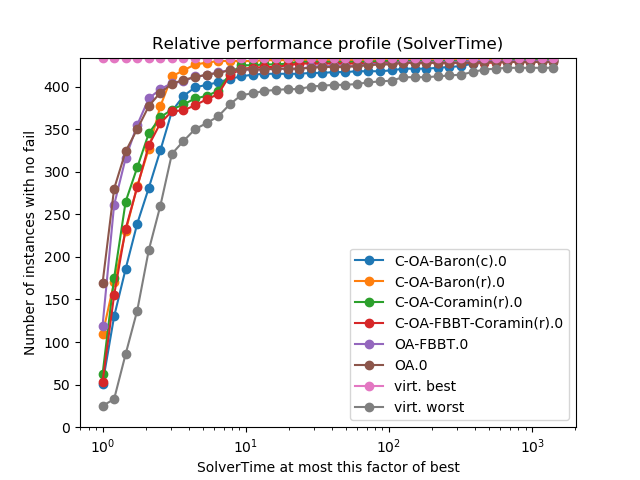
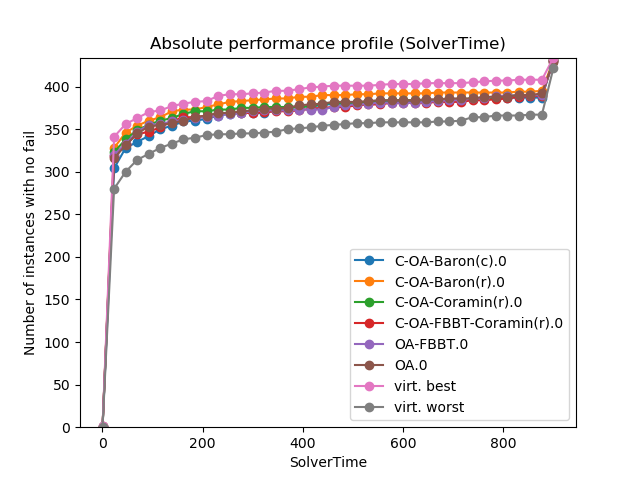
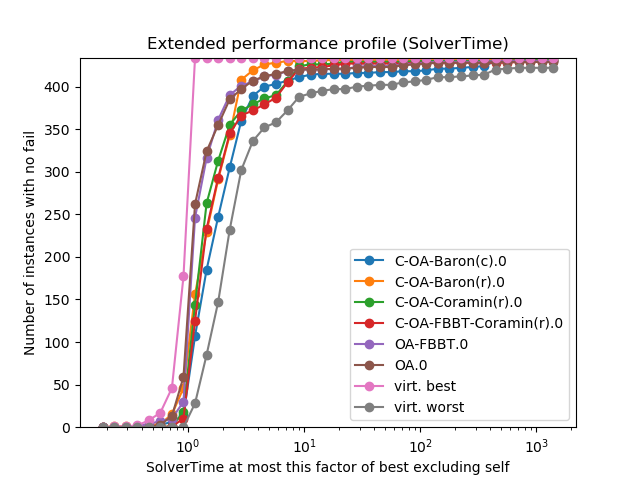
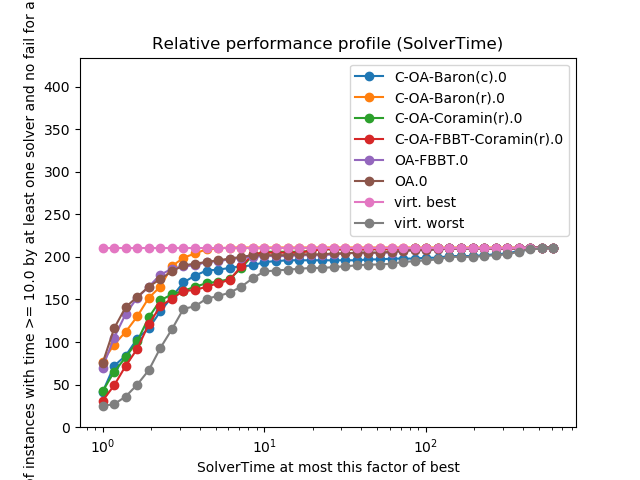
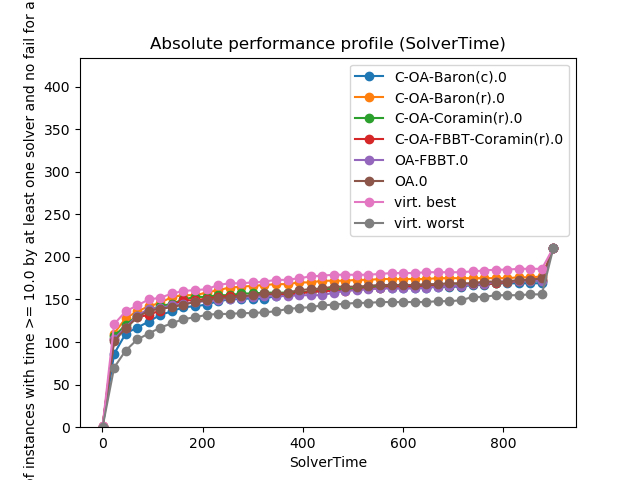
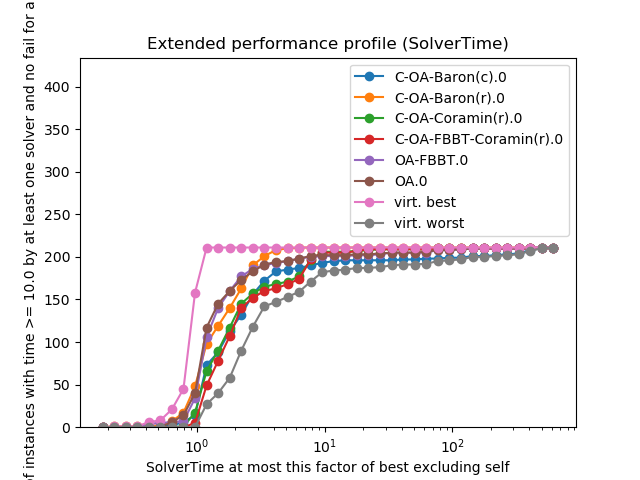
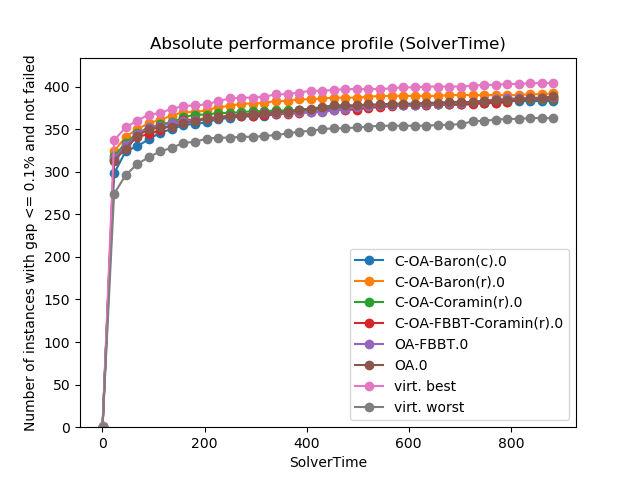
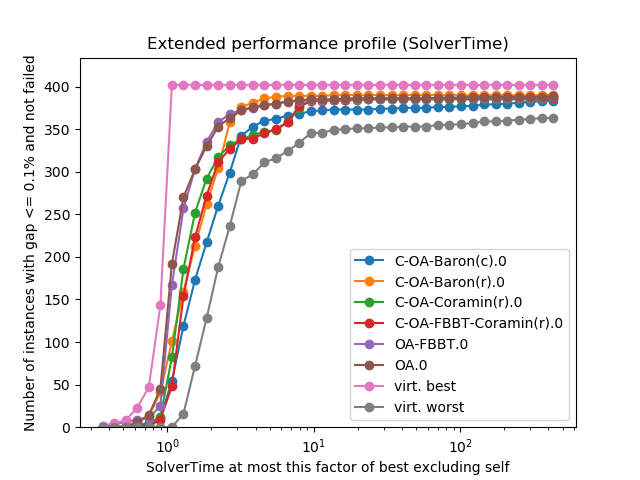
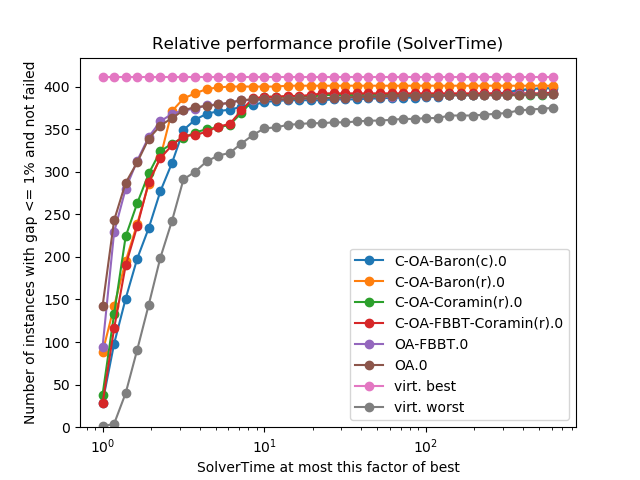
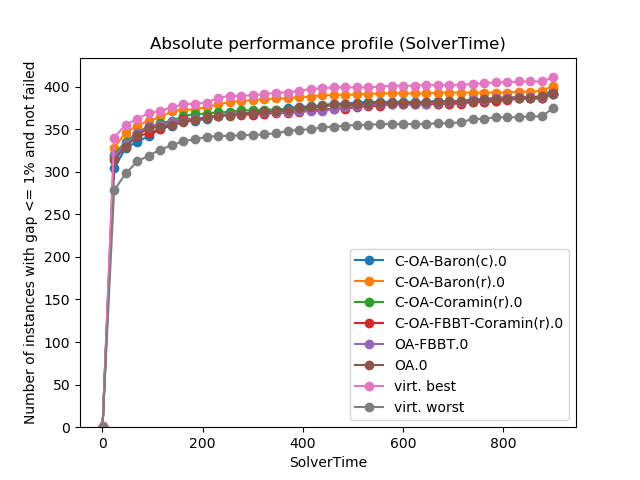
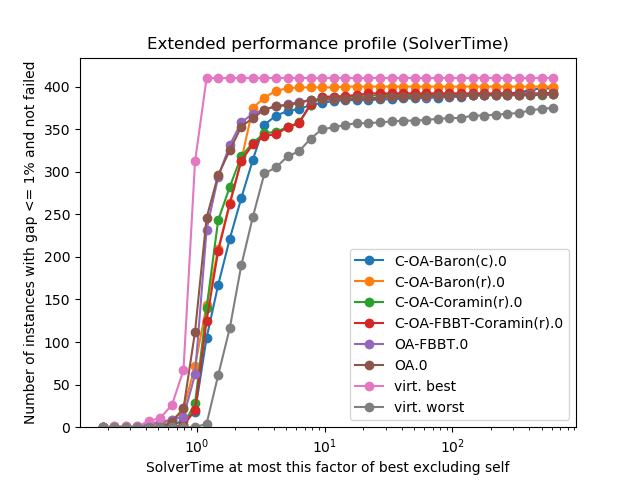
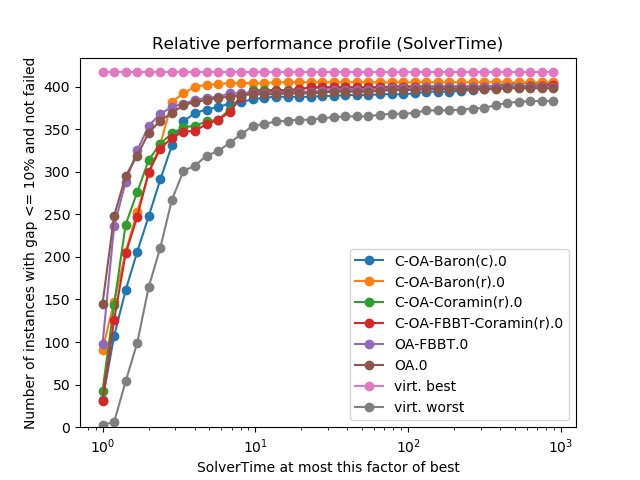
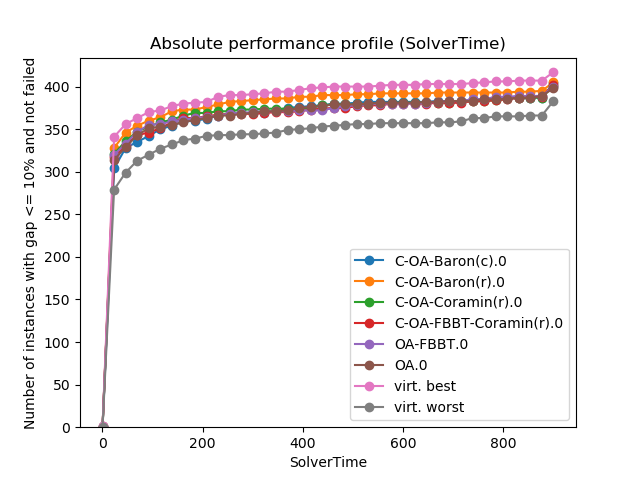
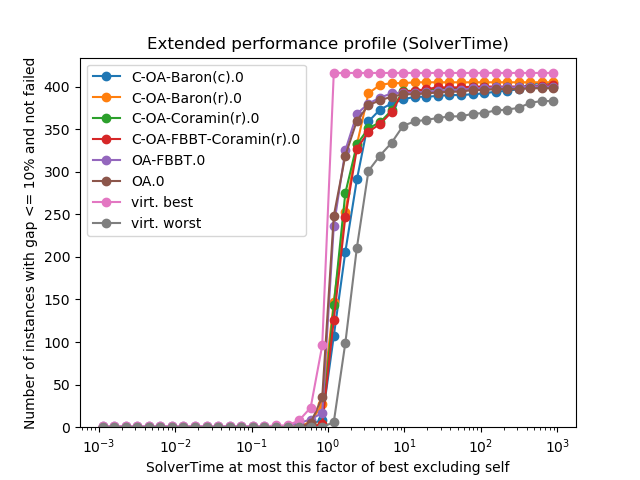
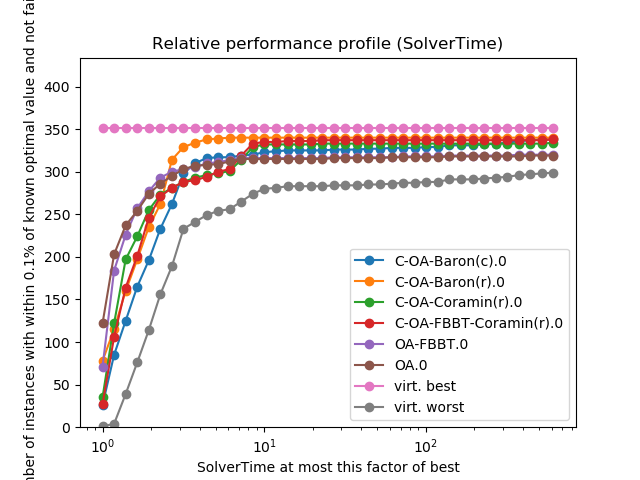
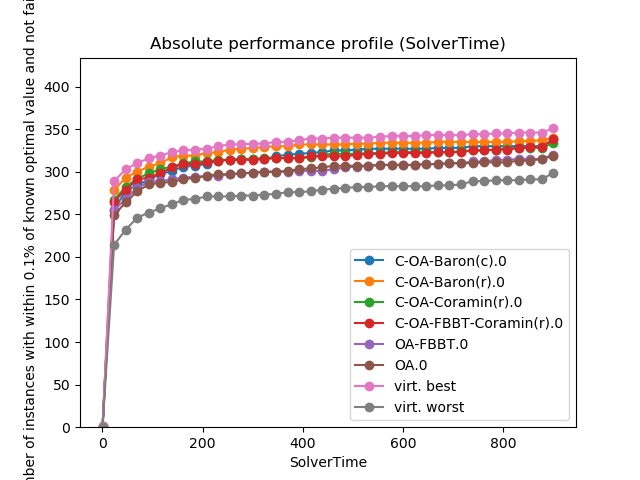
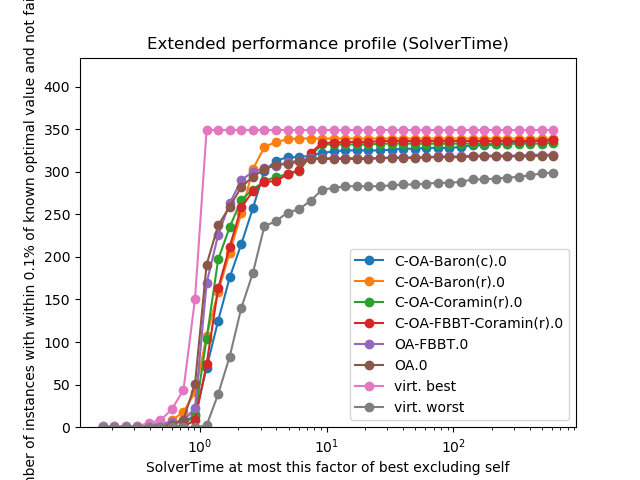
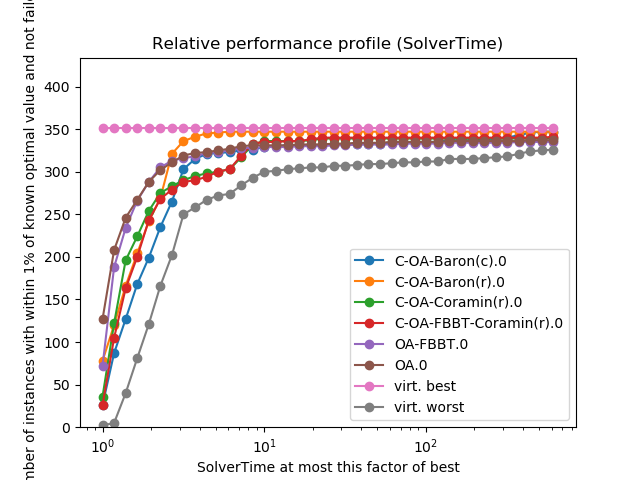
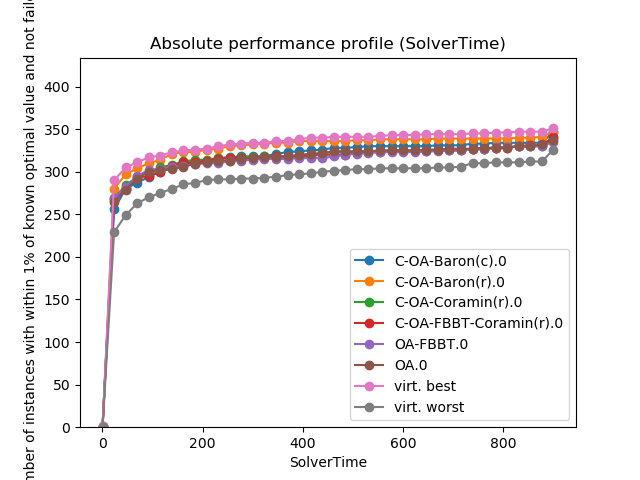
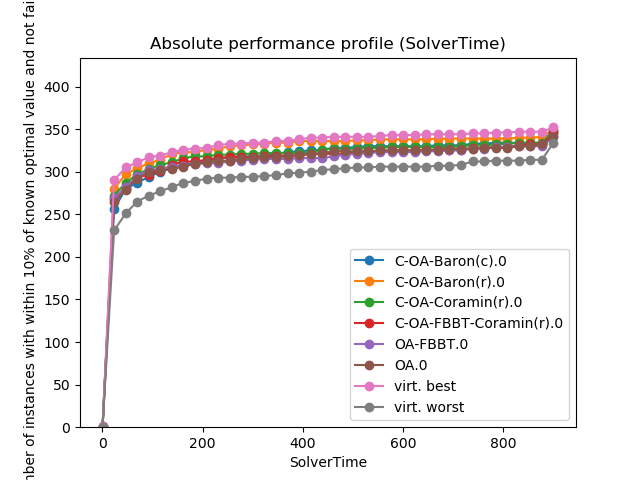
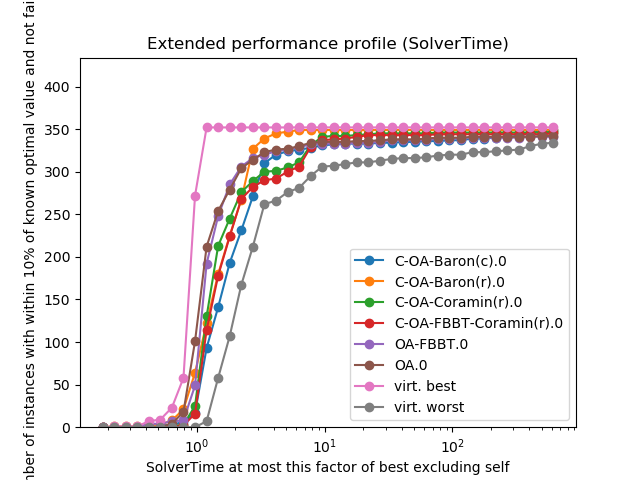
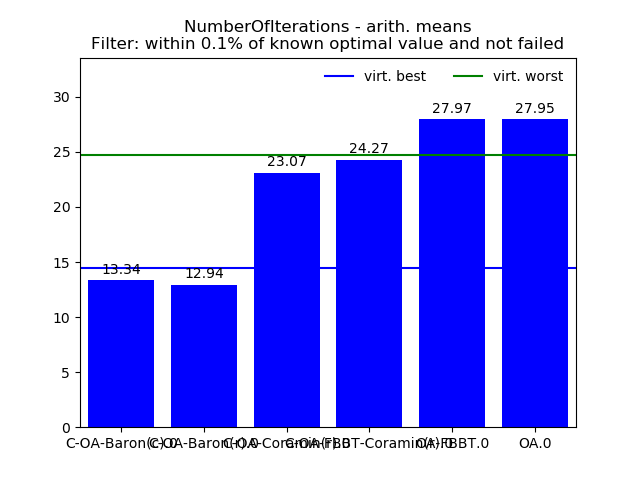
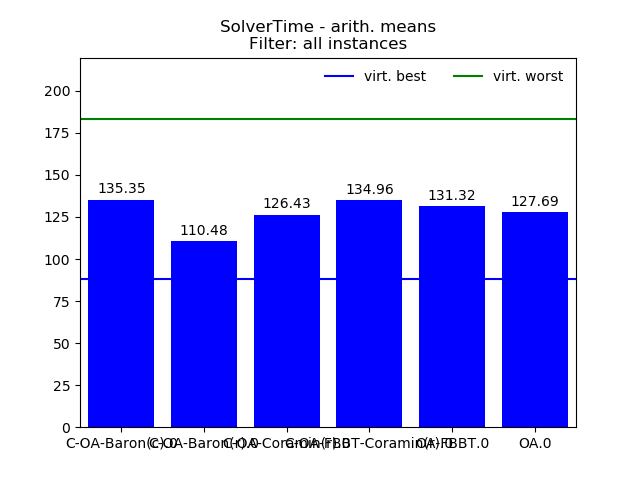
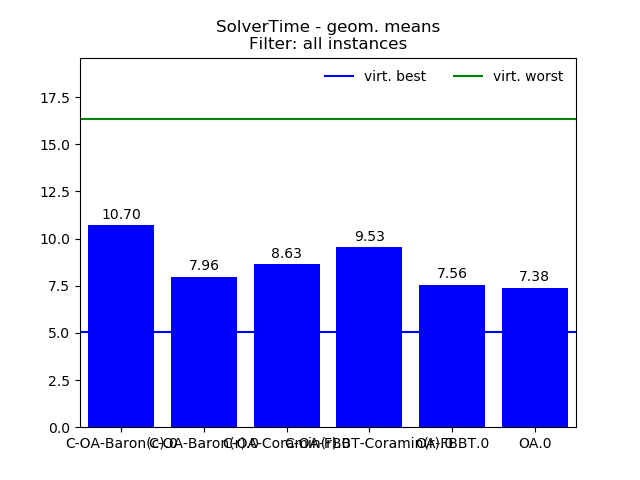
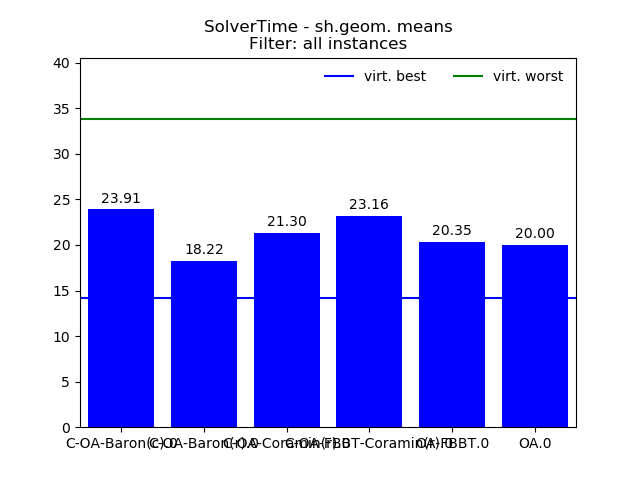
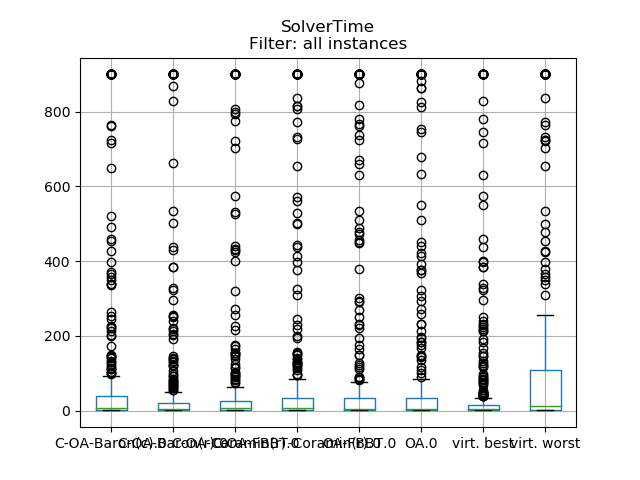
SolverTime
Filter: all instances
Attribute values were projected onto interval [0.1, 900.0].
Missing values and values for failed instances substituted by 900.0 .
| Data | C-OA-Baron(c).0 | C-OA-Baron(r).0 | C-OA-Coramin(r).0 | C-OA-FBBT-Coramin(r).0 | OA-FBBT.0 | OA.0 | virt. best | virt. worst |
|---|---|---|---|---|---|---|---|---|
| count | 434.00 | 434.00 | 434.00 | 434.00 | 434.00 | 434.00 | 434.00 | 434.00 |
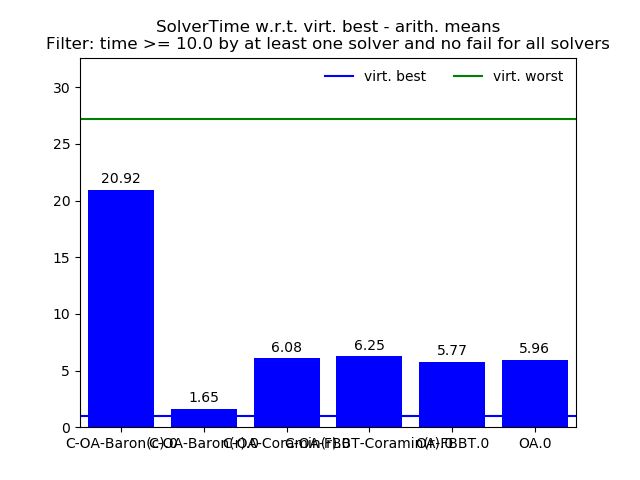
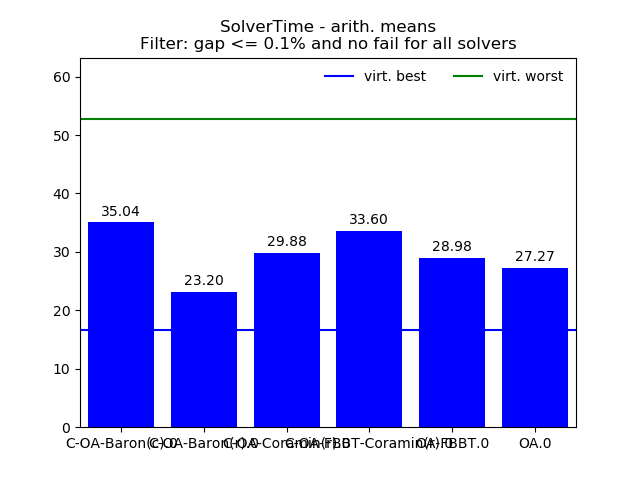
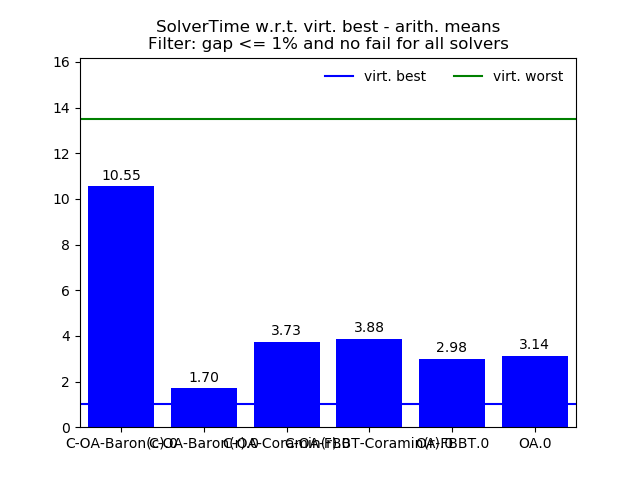
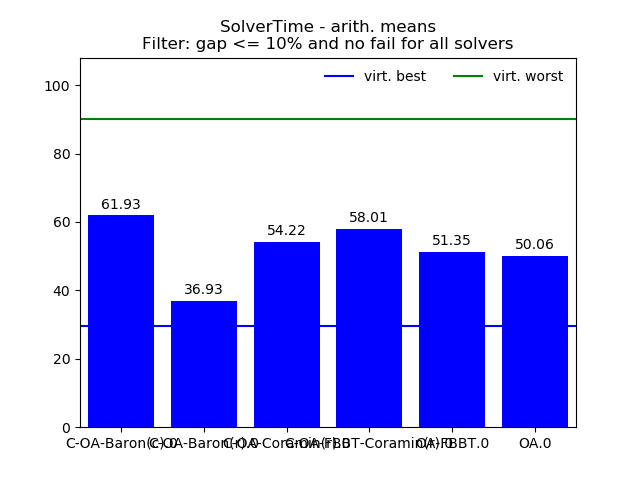
| arith. mean | 135.35 | 110.48 | 126.43 | 134.96 | 131.32 | 127.69 | 88.17 | 183.16 |
| arith. std. | 287.33 | 265.37 | 283.47 | 290.01 | 287.52 | 282.79 | 231.89 | 331.36 |
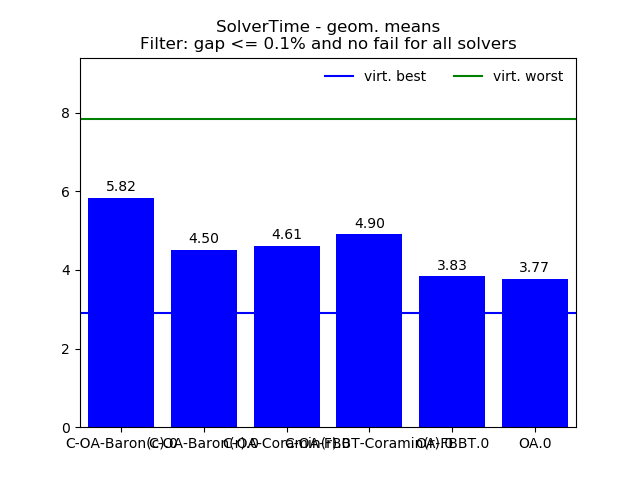
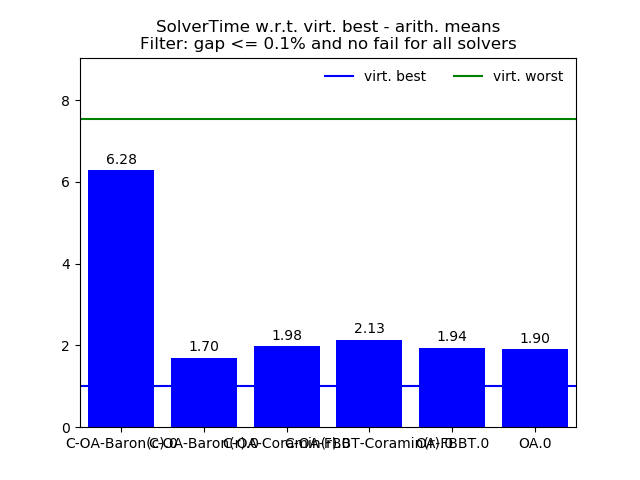
| geom. mean | 10.70 | 7.96 | 8.63 | 9.53 | 7.56 | 7.38 | 5.06 | 16.33 |
| geom. std. | 10.24 | 9.15 | 11.05 | 11.36 | 11.76 | 11.72 | 9.90 | 11.27 |
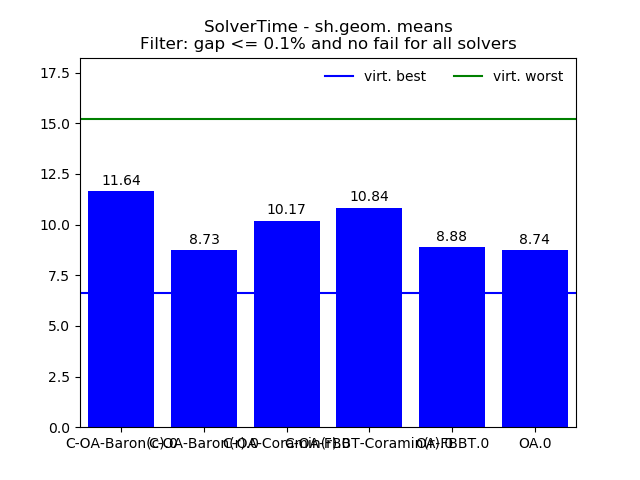
| sh.geom. mean | 23.91 | 18.22 | 21.30 | 23.16 | 20.35 | 20.00 | 14.22 | 33.80 |
| sh.geom. std. | 4.47 | 4.06 | 4.29 | 4.44 | 4.53 | 4.48 | 3.76 | 5.09 |
| min | 0.49 | 0.45 | 0.30 | 0.30 | 0.29 | 0.28 | 0.28 | 0.49 |
| 10.0% | 0.88 | 0.79 | 0.48 | 0.51 | 0.50 | 0.48 | 0.44 | 0.98 |
| 25.0% | 1.43 | 1.25 | 1.08 | 1.09 | 1.01 | 0.98 | 0.79 | 1.73 |
| 50.0% | 5.76 | 4.79 | 6.67 | 7.64 | 4.00 | 3.75 | 2.80 | 11.13 |
| 75.0% | 38.49 | 20.96 | 26.38 | 33.97 | 33.07 | 34.26 | 13.74 | 107.90 |
| 90.0% | 900.00 | 483.23 | 872.47 | 900.00 | 860.48 | 851.50 | 247.17 | 900.00 |
| max | 900.00 | 900.00 | 900.00 | 900.00 | 900.00 | 900.00 | 900.00 | 900.00 |
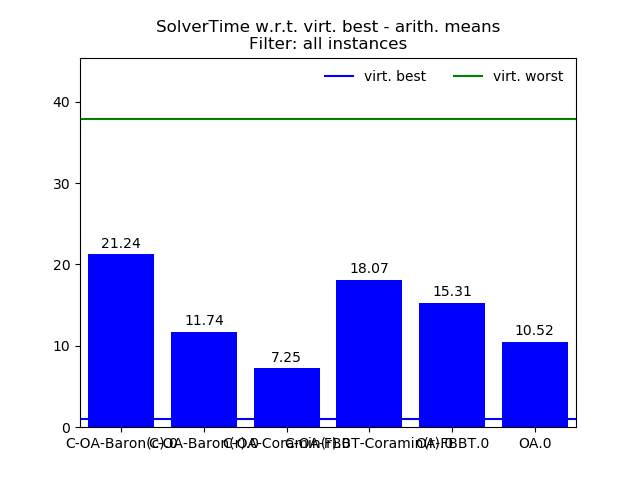
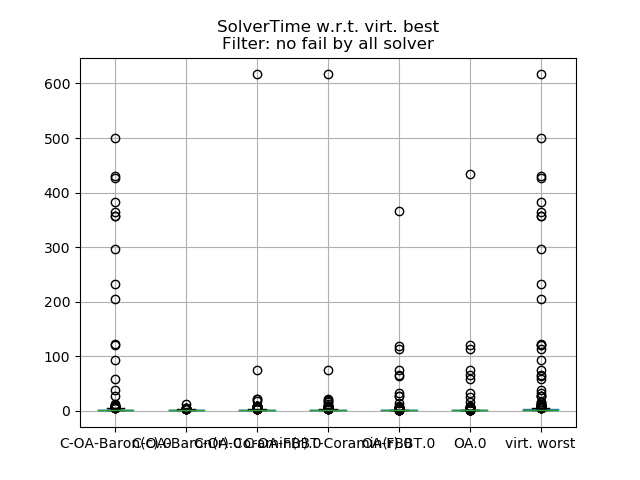
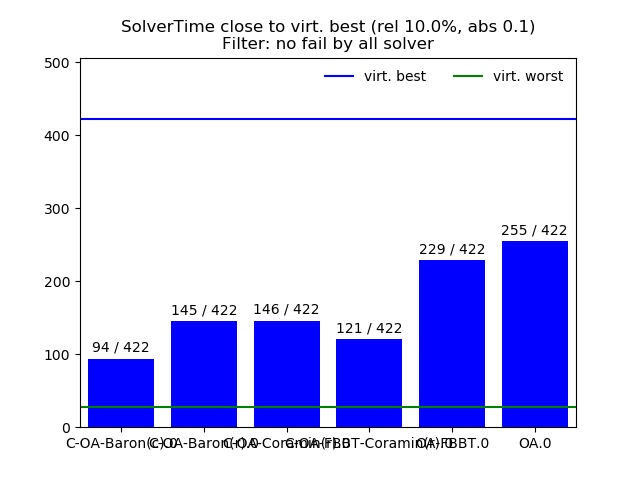
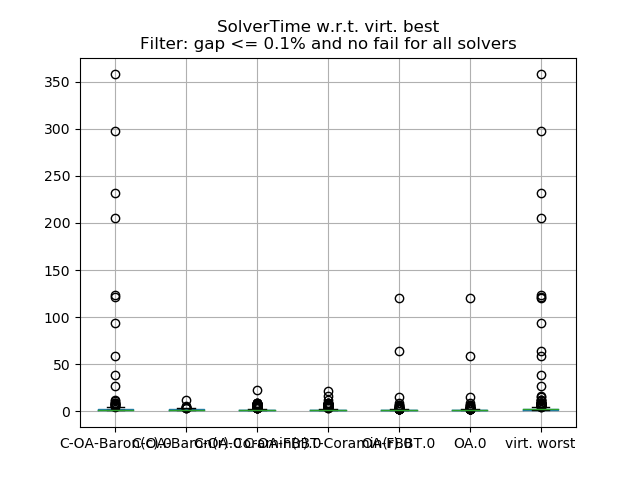
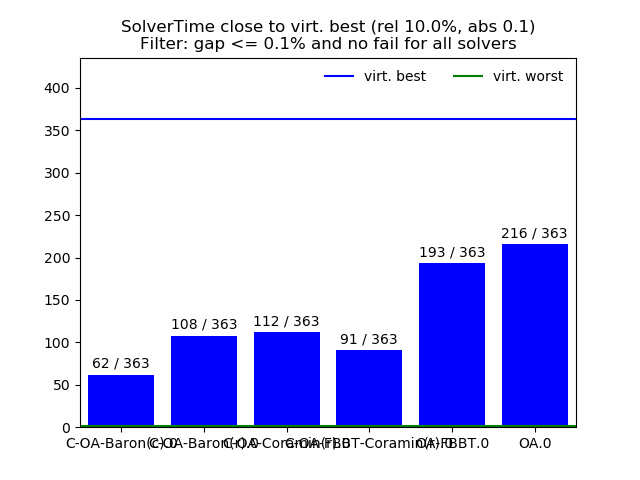
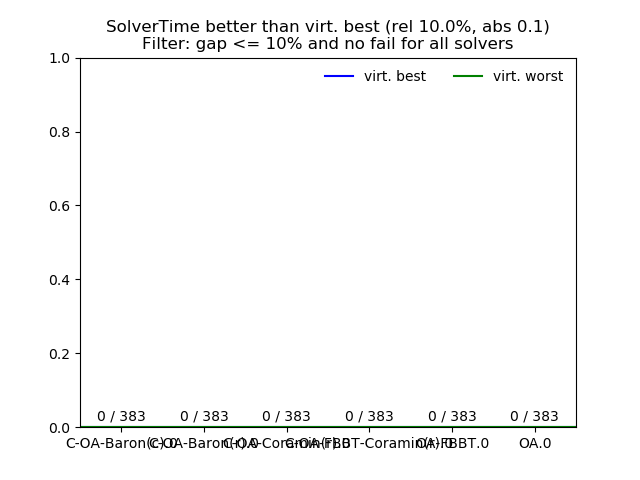
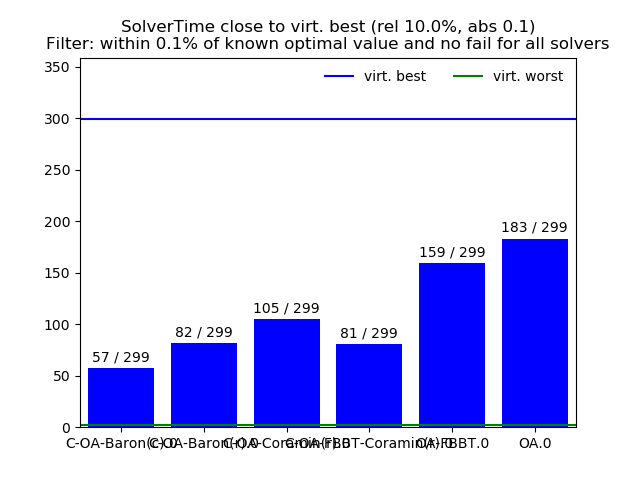
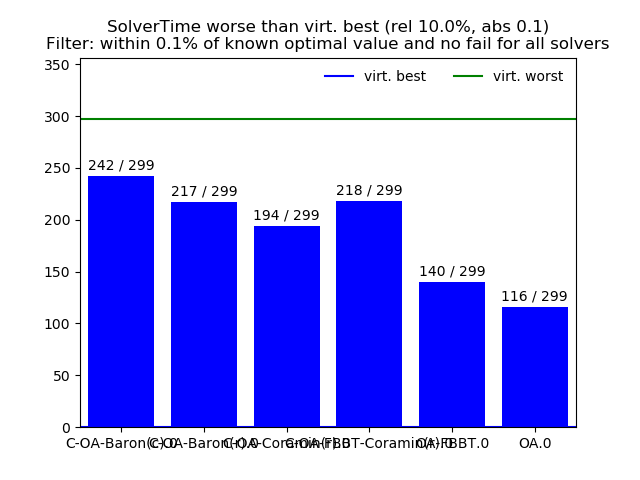
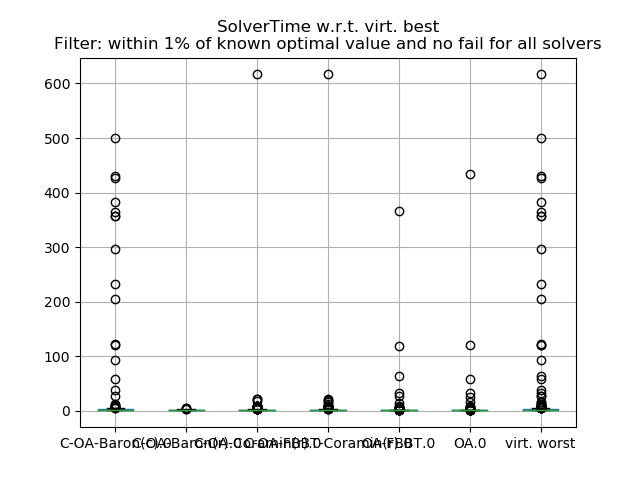
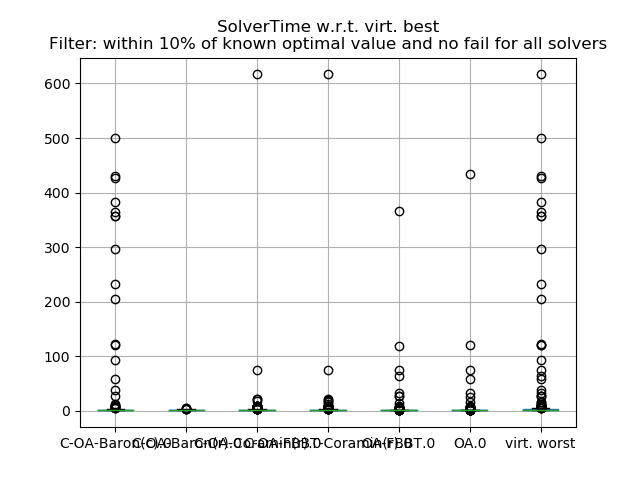
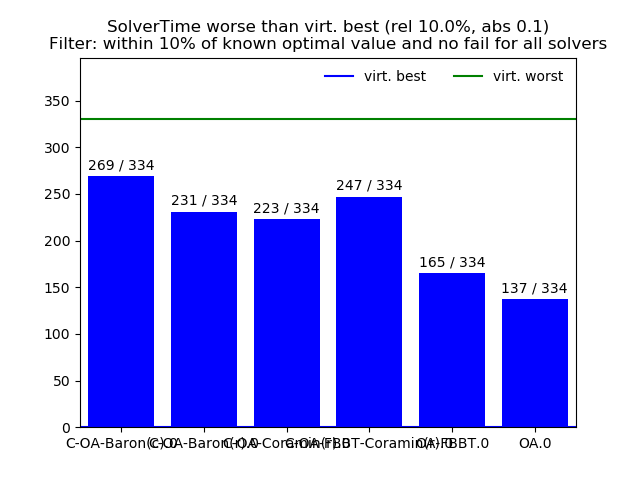
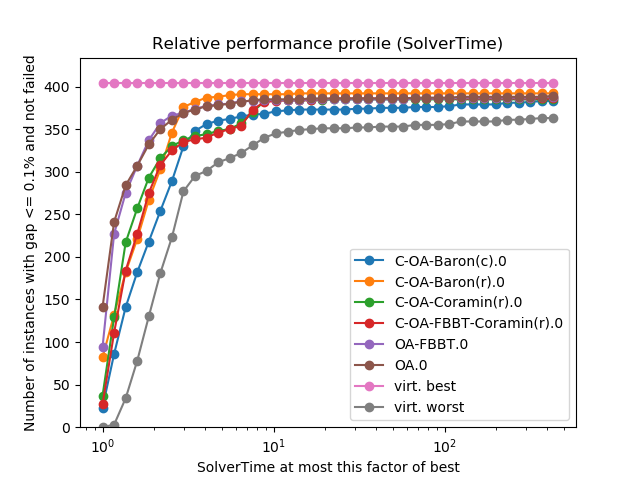
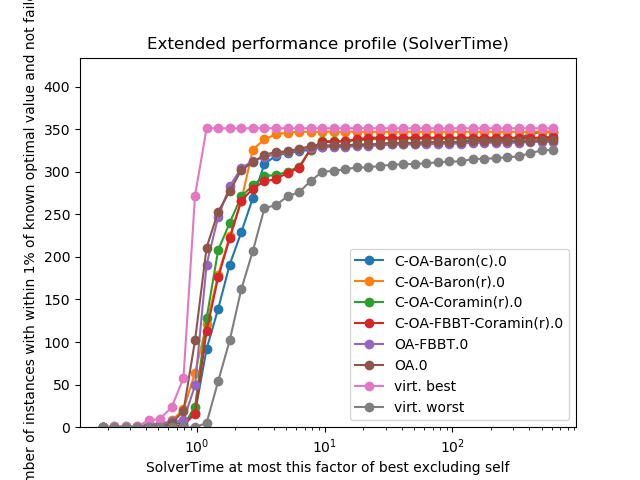
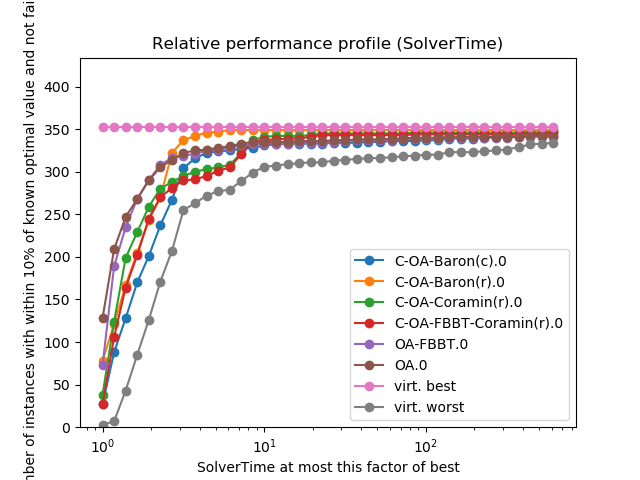
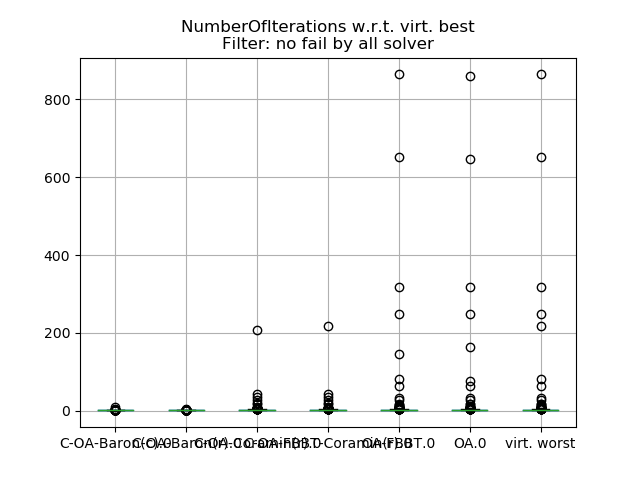
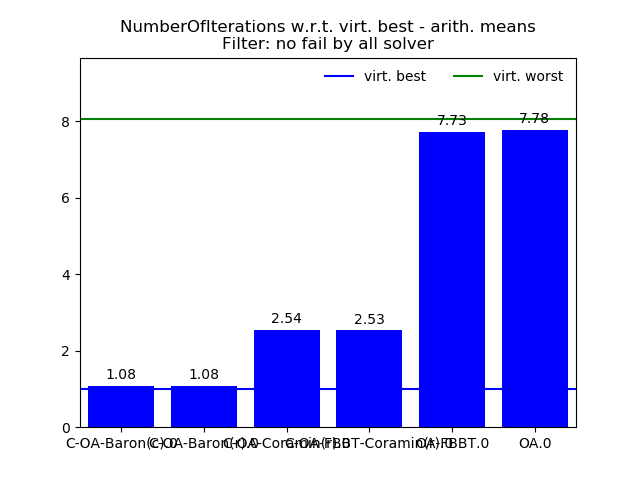
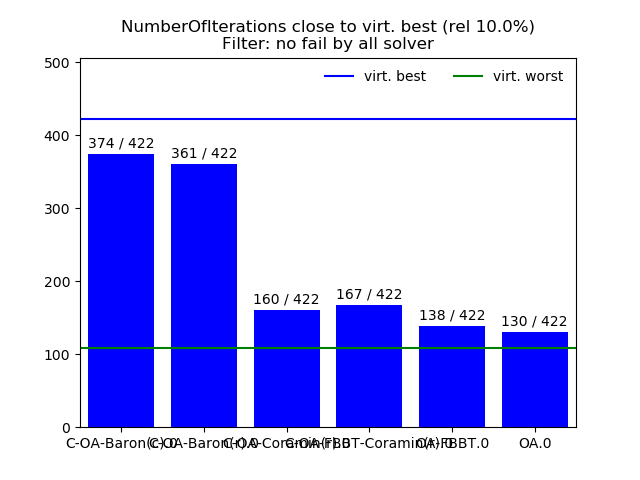
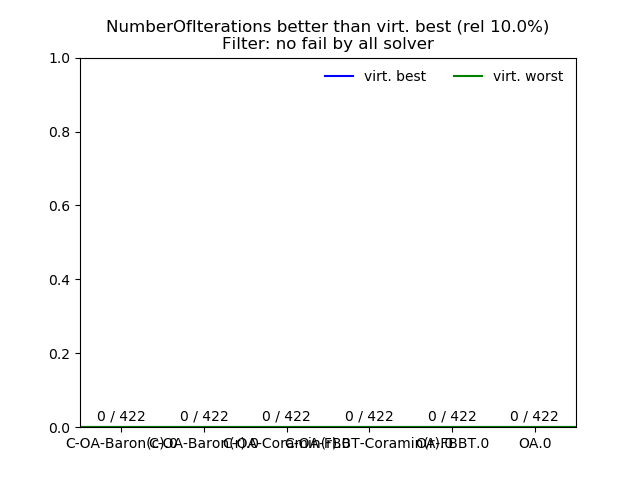
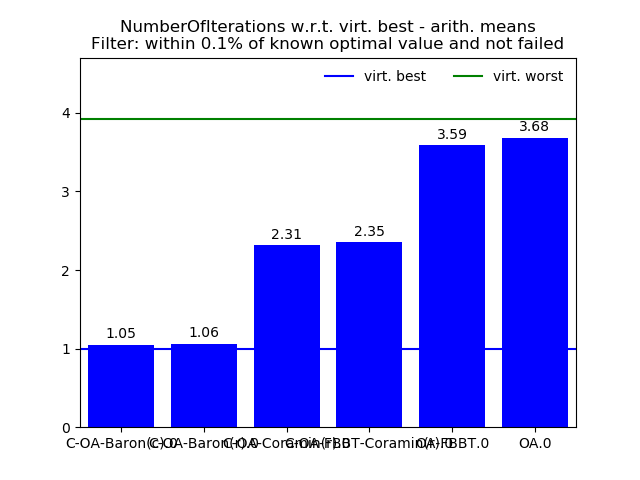
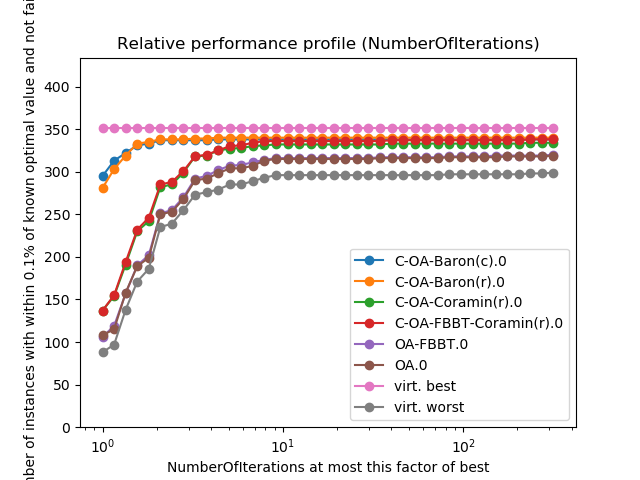
Performance with respect to virt. best:
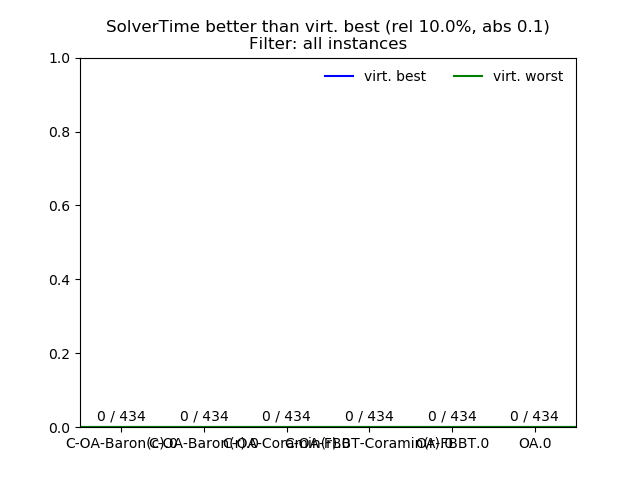
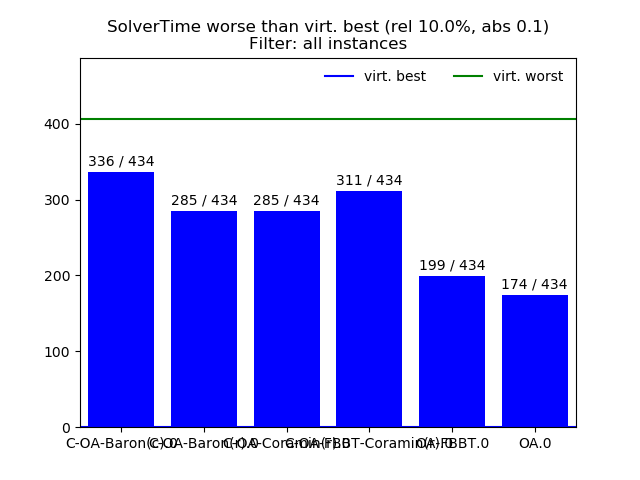
Tolerance:
relative 0.1
absolute 0.1
| Data | C-OA-Baron(c).0 | C-OA-Baron(r).0 | C-OA-Coramin(r).0 | C-OA-FBBT-Coramin(r).0 | OA-FBBT.0 | OA.0 | virt. worst |
|---|---|---|---|---|---|---|---|
| count | 434.00 | 434.00 | 434.00 | 434.00 | 434.00 | 434.00 | 434.00 |
| arith. mean | 21.24 | 11.74 | 7.25 | 18.07 | 15.31 | 10.52 | 37.84 |
| arith. std. | 166.10 | 157.20 | 68.70 | 151.49 | 136.78 | 86.69 | 215.61 |
| min | 1.00 | 1.00 | 1.00 | 1.00 | 1.00 | 1.00 | 1.00 |
| 10.0% | 1.00 | 1.00 | 1.00 | 1.00 | 1.00 | 1.00 | 1.26 |
| 25.0% | 1.16 | 1.00 | 1.08 | 1.13 | 1.00 | 1.00 | 1.57 |
| 50.0% | 1.60 | 1.39 | 1.29 | 1.39 | 1.10 | 1.07 | 2.19 |
| 75.0% | 2.53 | 2.09 | 1.89 | 2.02 | 1.49 | 1.47 | 3.11 |
| 90.0% | 3.79 | 2.63 | 5.37 | 6.26 | 2.28 | 2.41 | 8.97 |
| max | 2962.11 | 2962.11 | 1263.53 | 2228.45 | 2228.45 | 1263.53 | 2962.11 |
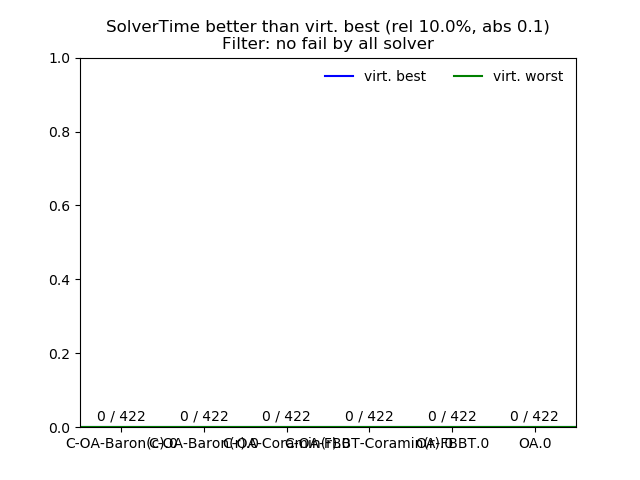
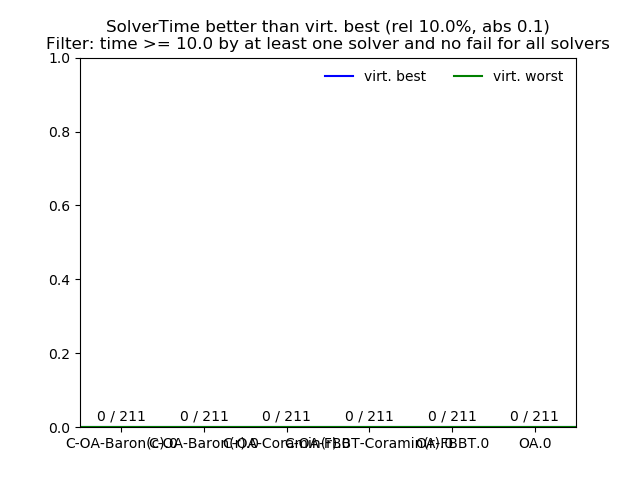
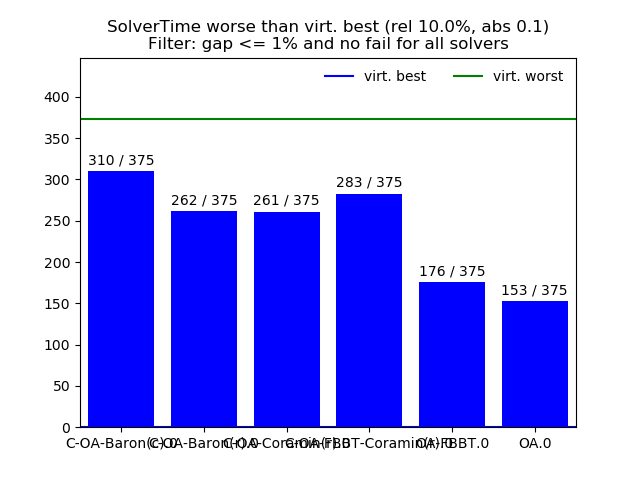
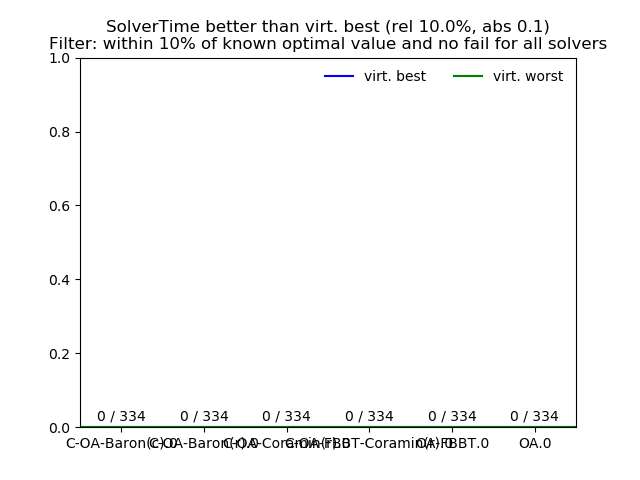
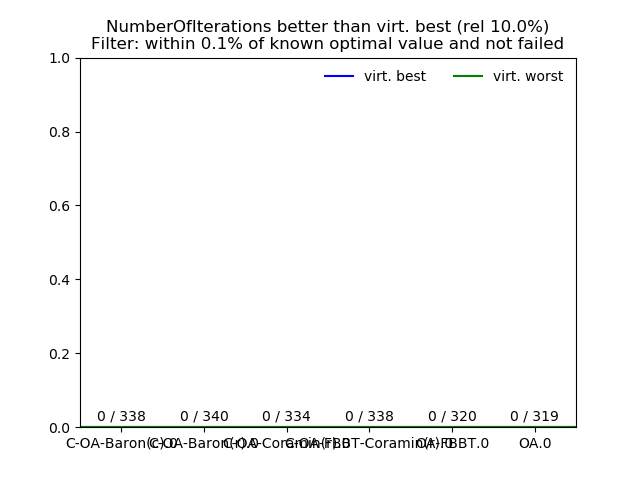
| better | 0.00 | 0.00 | 0.00 | 0.00 | 0.00 | 0.00 | 0.00 |
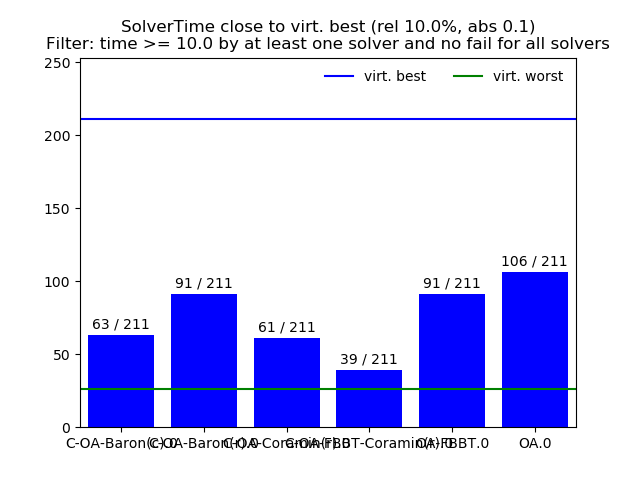
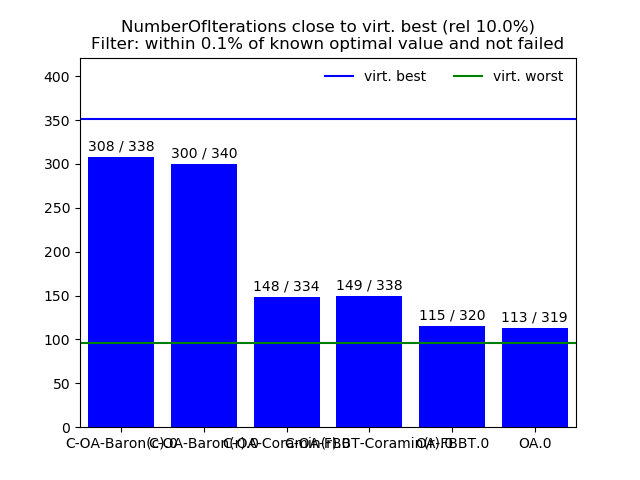
| close | 98.00 | 149.00 | 149.00 | 123.00 | 235.00 | 260.00 | 28.00 |
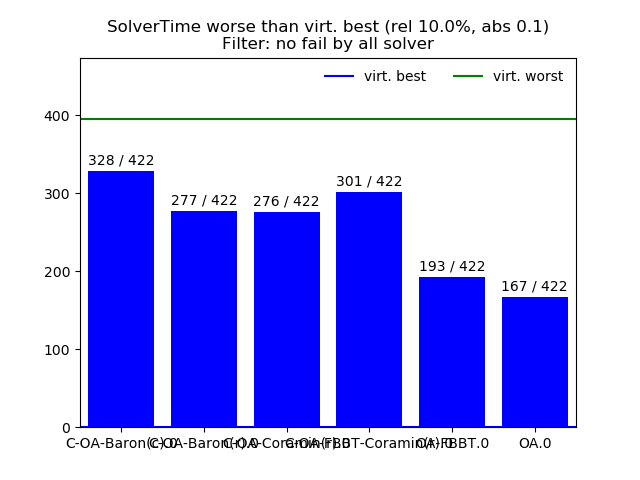
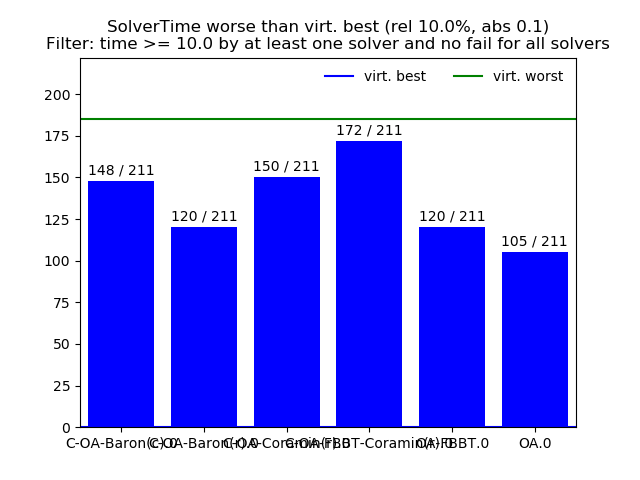
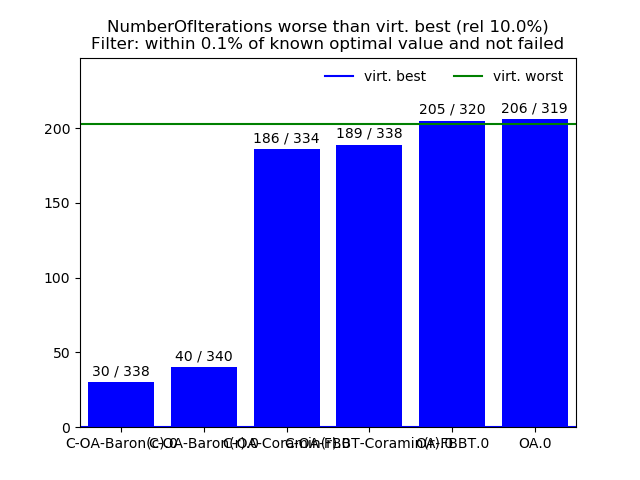
| worse | 336.00 | 285.00 | 285.00 | 311.00 | 199.00 | 174.00 | 406.00 |